What's your home going to be worth in 2016?
The answer to this question is of key importance to many of those looking to sell their homes. Although the future cannot be predicted, we can look at the data to tell us how things are shaping up for the year to come.
Let's start with the big picture. After 5 years of decline, the median price of a home in Maywood has been consistently rising since January of 2013. In fact, since 2013 the price of a home in Maywood has increased from $34,450.00 in December of 2012, to over $75,000 as of December 2015. In fact the price of the average home in Maywood has increased by over 50% in 2015.
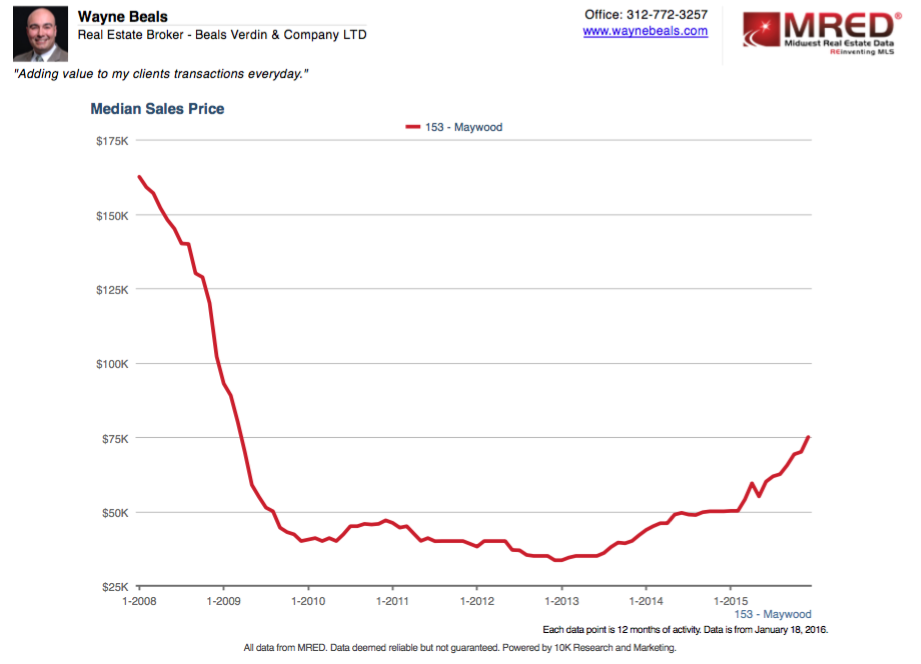
So, what's behind the improvement in prices. Are there more buyers looking for a home? Are there less homes for sale? The answer isn't as simple as you would think. Let's take a look at some of the factors that have led to where we are today.
Supply is down. Way down.
Supplies of new homes are at their lowest point since 2007.
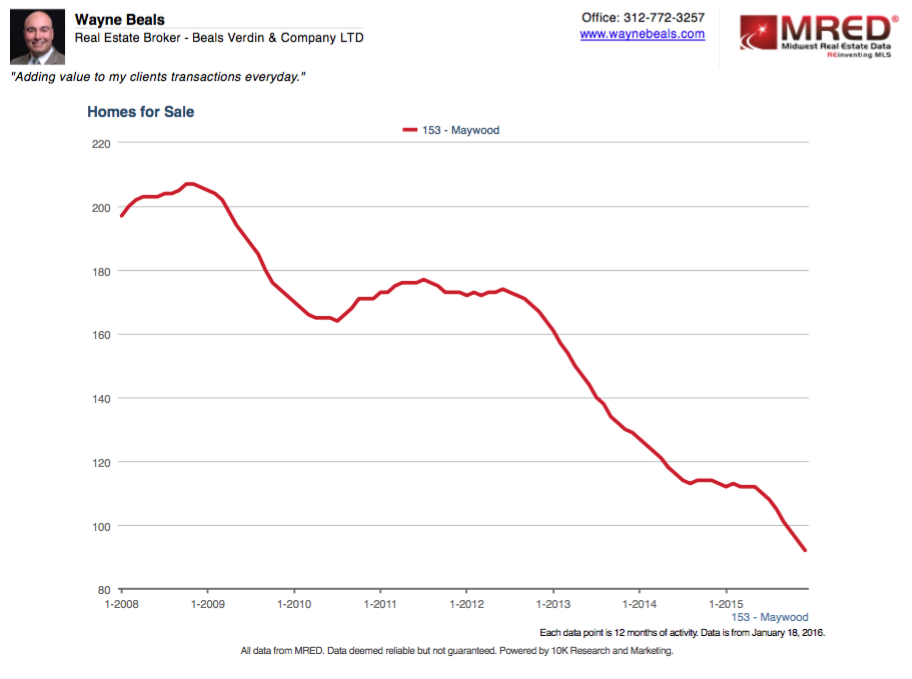
Why the decline you ask? A couple reasons.
Foreclosures have been in decline since 2013, and have reached a 7 year low.
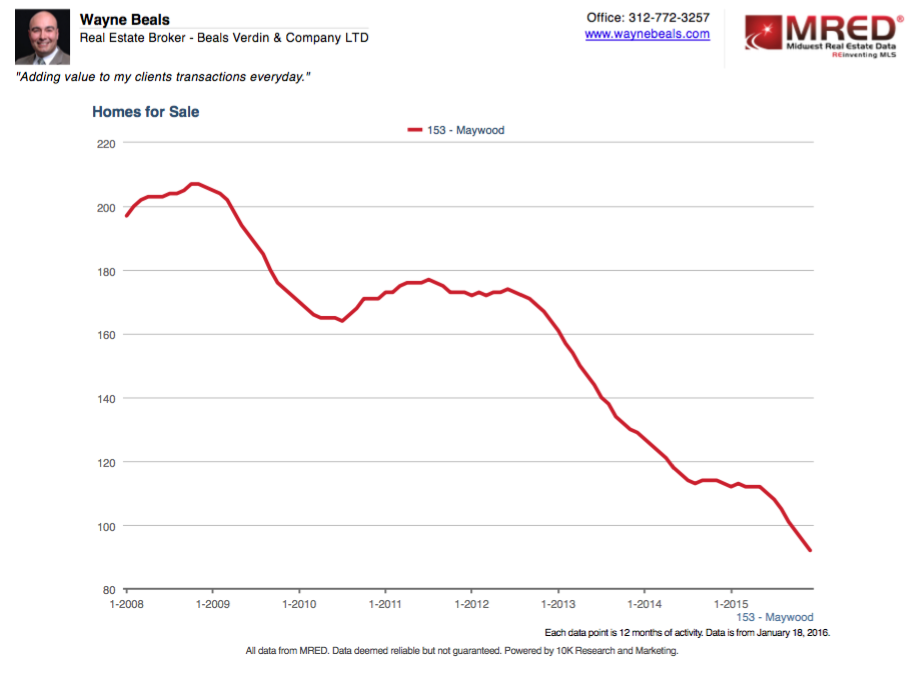
Since 2008, banks have provided the lion's share of the inventory available to homebuyers, but that trend has began to change. Bank owned inventories have steadily declined.
Homes that have been foreclosed and repossessed are sold "as is." They are typically in poor condition and need substantial reinvestment. Due to poor condition, mortgage options are very limited for potential homebuyers, as banks typically only finance homes in good condition. This means that most successful transactions go to cash investor buyers, who comprise a smaller segment of the market than homebuyers. This reduction in demand and the corresponding increase in the supply of homes available during the foreclosure crisis, places downward pressure on home values.
The number of traditional sales (private party, with no bank involvement) has been in decline since 2008.
Sellers who don't need to sell, don't when the market is down.
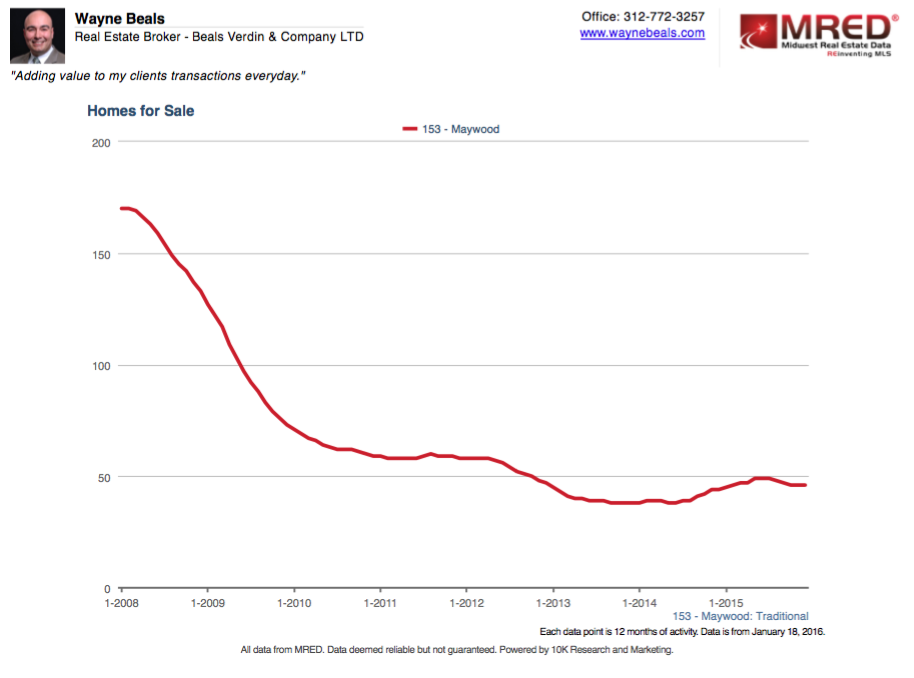
As value has been lost, more sellers choose not to sell their homes at a low price. The sellers will likely continue to choose to stay in their home until prices improve significantly. Once prices improve, these entrenched sellers will likely choose to sell and and slowly inventories will rise.
Demand has (almost) returned to pre-crash levels.
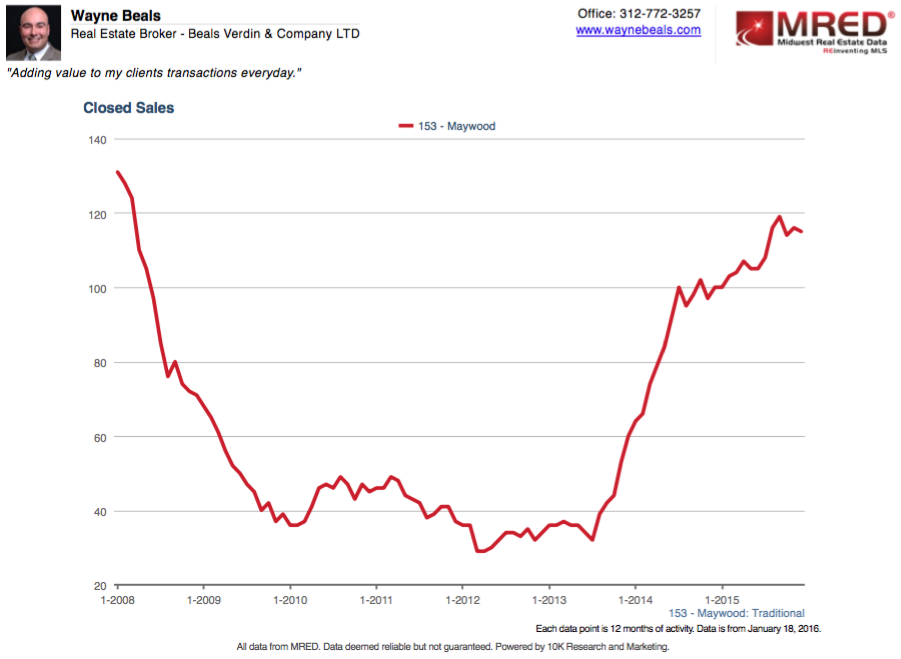
Higher rents and continued low interest rates are creating a strong incentive for consumers to a purchase home vs. continuing to rent. Rehabbers have continued to fix foreclosed homes and resell them in peak condition to "first time" and "recovering" homebuyers. The availability of downpayment assistance programs has lowered the amount of cash that a homebuyer needs for a downpayment, in many cases, to as little as $1,000. This assistance creates more incentive to purchase vs. rent. That said, credit standards for mortgages are still high, and it's unlikely that they will loosen anytime soon.
So, what's going to happen in 2016?
The forecast is for the improvement in prices to continue, and likely at a brisk pace. The most telling leading indicator of price direction is Months Supply. Months Supply is simply the amount of time that it takes for all the homes in a market to be absorbed by all the potential buyers int he market. Months Supply peaked at at high of 19.3 months in March of 2010. It's currently at 4.7 months as of December 2015, which is the lowest point in the past 7 years. This graph shows that the Months Supply of home in Maywood is quickly approaching seller's market conditions.
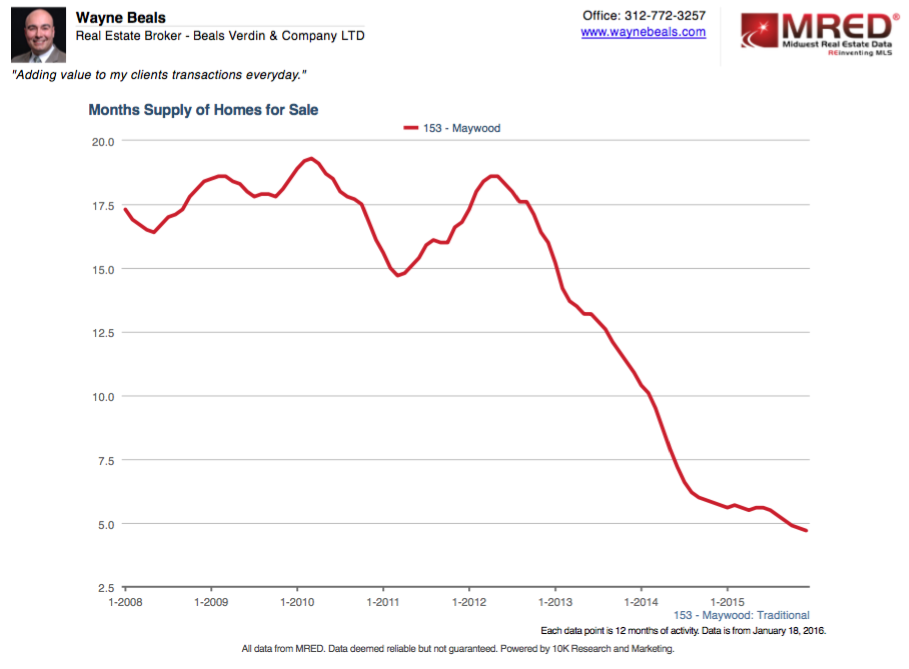
Months Supply level under 3 months generally favors the seller's position and creates a climate for multiple offers and price increases.


